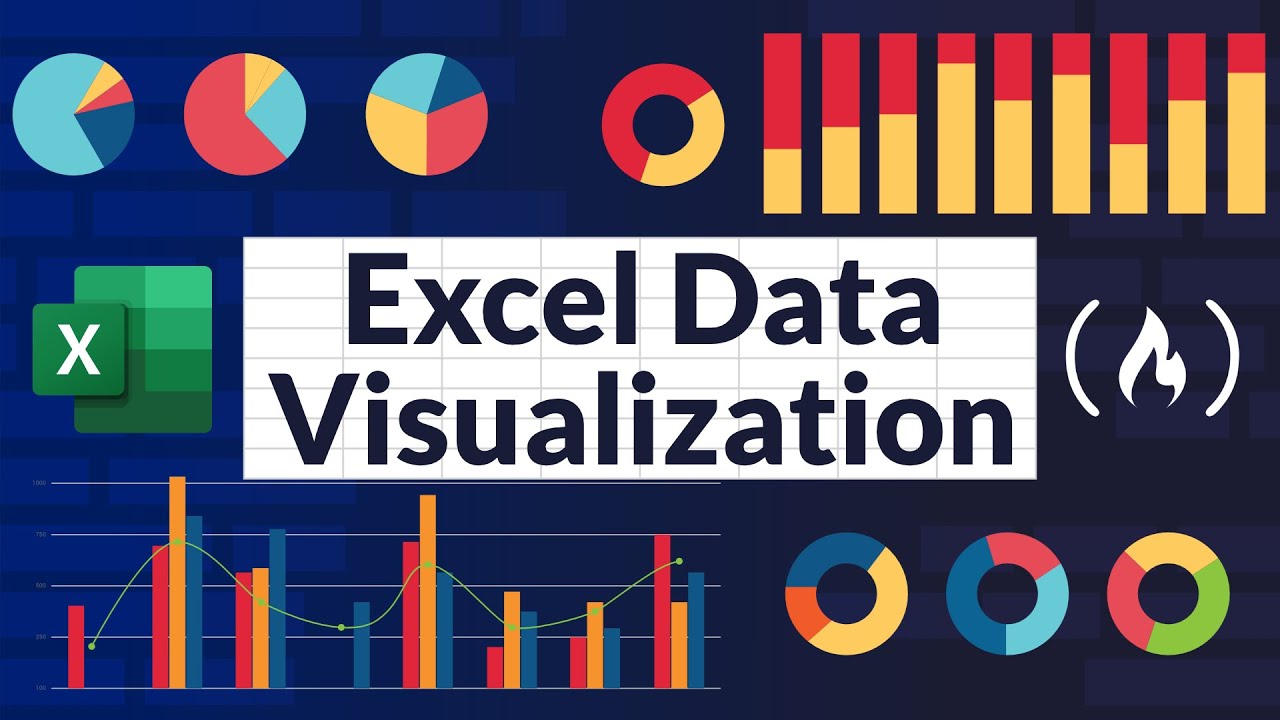
Excel Data Visualization Course – Guide to Charts & Dashboards
1 lesson, about 1 hour
A single session, about 1 hour, published on YouTube by freeCodeCamp.org. Watched here on the course page.
Eleven and a half hours on D3 used inside React, which is the harder and more common case: two libraries that both want to own the DOM, and the patterns that let them coexist.
The session is watched here on the course page.
No reviews yet. Be the first to review this course.
1 lesson, about 1 hour
A single session, about 1 hour, published on YouTube by freeCodeCamp.org. Watched here on the course page.
1 lesson, about 20 hours
A single session, about 20 hours, published on YouTube by freeCodeCamp.org. Watched here on the course page.
1 lesson, about 13 hours
A single session, about 13 hours, published on YouTube by freeCodeCamp.org. Watched here on the course page.
1 lesson, about 9 hours
A single session, about 9 hours, published on YouTube by Bogdan Stashchuk. Watched here on the course page.
1 lesson, about 3 hours
A single session, about 3 hours, published on YouTube by Coding With Sagar. Watched here on the course page.
1 lesson, 51 minutes
A single session, 51 minutes, published on YouTube by Intellipaat. Watched here on the course page.
1 lesson, about 20 hours
A single session, about 20 hours, published on YouTube by freeCodeCamp.org. Watched here on the course page.
1 lesson, about 13 hours
A single session, about 13 hours, published on YouTube by freeCodeCamp.org. Watched here on the course page.
1 lesson, about 9 hours
A single session, about 9 hours, published on YouTube by Bogdan Stashchuk. Watched here on the course page.